Automated reporting in quality control is transforming how manufacturers and quality managers interpret, share, and act on inspection data. By leveraging advanced data visualization tools, organizations can turn complex inspection results into clear, actionable insights. This shift not only accelerates decision-making but also improves transparency, compliance, and overall product quality.
As digital transformation continues across industries, the integration of automated reporting with visual analytics is becoming a standard practice. These systems streamline the process of gathering, analyzing, and presenting quality data, making it easier for teams to identify trends, spot anomalies, and respond to issues in real time.
For those interested in related advancements, exploring augmented reality in quality audits reveals how immersive technologies are also reshaping the way data is visualized and understood on the factory floor.
The Evolution of Data Visualization in Automated Quality Reporting
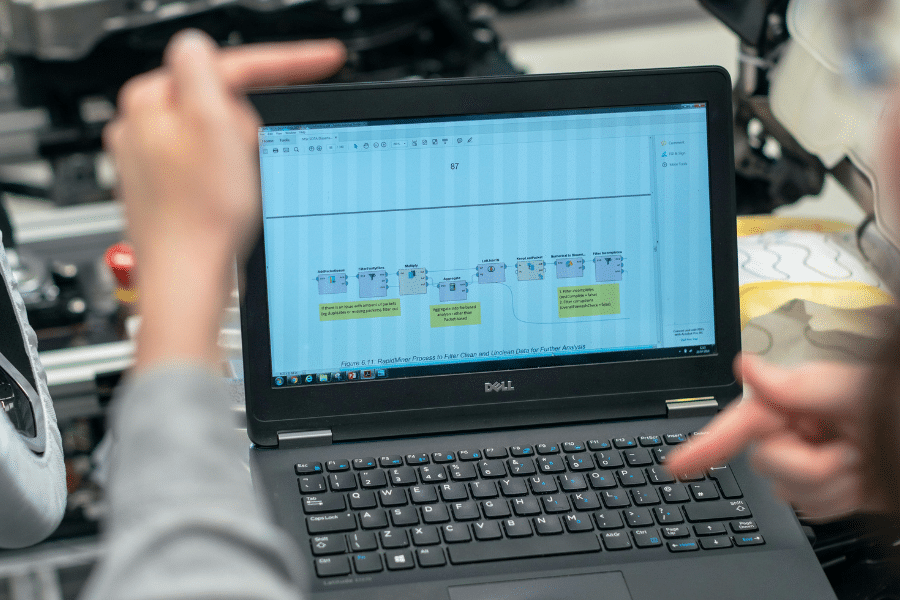
The journey from manual spreadsheets to automated dashboards has redefined quality control processes. Early reporting relied heavily on static documents and manual data entry, which were time-consuming and prone to human error. Today, automated systems collect data directly from inspection devices, sensors, and AI-powered cameras, feeding this information into dynamic visualization platforms.
Modern data visualization tools present inspection results through interactive charts, heatmaps, and trend lines. These visuals help teams quickly grasp the status of production lines, identify recurring defects, and monitor key performance indicators. As a result, organizations can shift from reactive problem-solving to proactive quality management.
Key Benefits of Automated Reporting for Quality Control Teams
Implementing automated reporting in quality control brings several tangible advantages:
- Real-Time Insights: Automated systems provide up-to-the-minute data, enabling teams to detect and address quality issues as soon as they arise.
- Reduced Human Error: By eliminating manual data entry, these tools minimize the risk of mistakes and ensure more accurate reporting.
- Improved Collaboration: Visual dashboards can be shared across departments, fostering better communication between quality, production, and management teams.
- Faster Decision-Making: Clear visualizations help stakeholders quickly interpret data, prioritize actions, and implement corrective measures.
- Regulatory Compliance: Automated reporting systems can be configured to meet industry standards, making it easier to generate audit-ready documentation.
These benefits help organizations maintain high standards, reduce waste, and enhance customer satisfaction.
How Data Visualization Enhances Automated Quality Reporting
Data visualization is the bridge between raw inspection data and actionable insights. By presenting information in a visually engaging format, teams can quickly spot deviations, patterns, and potential risks. For example, a heatmap of defect locations on a product can reveal process weaknesses, while trend charts can highlight gradual shifts in quality metrics.
Effective visualization tools also allow users to drill down into specific data points, filter results by date or production line, and generate custom reports tailored to different audiences. This flexibility ensures that everyone, from line operators to executives, can access the information they need in a format that supports their role.
Integrating AI and Machine Learning into Quality Reporting
The latest advancements in automated reporting for quality control involve the integration of artificial intelligence and machine learning. These technologies can analyze vast amounts of inspection data, identify subtle patterns, and even predict future defects based on historical trends. AI-powered visual inspection systems, for example, can automatically flag anomalies and generate detailed reports without human intervention.
For a deeper dive into how deep learning is shaping visual inspection, consider reading this comprehensive overview of deep learning for visual inspection. These innovations are making automated reporting more intelligent, adaptive, and valuable for manufacturers.
Additionally, tools such as hyperparameter tuning for inspection models are helping teams optimize their AI systems for even greater accuracy and reliability.
Best Practices for Implementing Automated Reporting and Visualization
To maximize the impact of automated reporting and data visualization in quality control, organizations should follow several best practices:
- Define Clear Objectives: Identify the key metrics and outcomes you want to track, such as defect rates, process efficiency, or compliance status.
- Standardize Data Collection: Ensure that all inspection devices and systems collect data in a consistent format for seamless integration and analysis.
- Choose the Right Visualization Tools: Select platforms that offer customizable dashboards, interactive features, and compatibility with your existing systems.
- Train Your Team: Provide training on how to interpret visual reports and use the insights to drive continuous improvement.
- Monitor and Refine: Regularly review your reporting processes and visualization tools to ensure they continue to meet your evolving needs.
By following these steps, companies can create a robust foundation for data-driven quality management.
Challenges and Considerations in Automated Quality Reporting
While the benefits are significant, there are also challenges to consider when adopting automated reporting and visualization:
- Data Integration: Combining data from multiple sources and legacy systems can be complex and may require custom solutions.
- Change Management: Shifting from manual to automated processes often requires cultural change and buy-in from all stakeholders.
- Data Security: Protecting sensitive quality data from unauthorized access is essential, especially when using cloud-based platforms.
- Initial Investment: Implementing new systems may involve upfront costs for software, hardware, and training.
Addressing these challenges early on will help ensure a smooth transition and long-term success.
Future Trends in Automated Reporting and Data Visualization
The landscape of automated reporting in quality control is rapidly evolving. Emerging trends include the use of augmented reality for real-time data overlays, mobile dashboards for on-the-go access, and more sophisticated AI algorithms for predictive analytics. As these technologies mature, quality teams will have even more powerful tools to ensure product excellence and operational efficiency.
For example, wearable AI solutions are starting to assist manual inspectors by providing instant feedback and visual cues, as explored in the topic of wearable AI for manual inspection support. These innovations are making quality control more interactive and data-driven than ever before.
FAQ
How does automated reporting improve quality control processes?
Automated reporting streamlines the collection and analysis of inspection data, reducing manual effort and minimizing errors. By presenting results through clear visualizations, teams can quickly identify issues, monitor trends, and take corrective action, leading to more consistent product quality and faster response times.
What types of data visualization are most effective in quality control?
Common visualization methods include interactive dashboards, heatmaps, control charts, and Pareto diagrams. These tools help teams understand complex data sets, spot patterns, and communicate findings effectively across departments.
Can automated reporting systems integrate with existing quality management software?
Yes, most modern automated reporting platforms are designed to integrate with a wide range of quality management and ERP systems. This ensures seamless data flow and allows organizations to leverage their existing technology investments while enhancing reporting capabilities.